热图(heatmap)
热图能够直观地显示不同样本、位点之间的差异及聚类情况,是一个展示基因组不同区域不同特性的有效手段,常用于基因表达差异、表观遗传修饰差异等多种分析中。Circos通过type = heatmap的
1、基础知识
与柱状图一样,热图也是基因组坐标上对应数值。并且将数值线性地映射到一组颜色上。映射的方式为:
The track linearly maps a range of values [min,max] onto a list of colors c[n], i=0..N.
f = (value - min) / ( max - min )
n = 0      if f < 0
    N      if f > 1
    N * f  otherwise
定义一个热图的方式跟条形图类似: 类型、文件名、半径的大小
<plot>
type  = heatmap
file  = data/5/segdup.hs1234.heatmap.txt
r1    = 0.89r
r0    = 0.88r
</plot>
2、对数坐标系:
有的时候数据非常分散,直接用线性方式作图可能会受到极大值和极小值的影响,这时候我们可以使用对数坐标
n = N f*(1/scale_log_base) scale_log_base = 5
当scale_log_base大于1的时候,靠近最小值的数值区域会被拉伸,相反小于1的时候大值部分的数据将会拉伸。
3、颜色:
热图的颜色是由CSV格式数据或颜色列表(list)来决定的。 一种简单定义颜色的方式:color = hs1_a5,hs1_a4,hs1_a3,hs1_a2,hs1_a1,hs1 更多颜色定义方式可以在配置文件中找到colors.conf
3.1常见颜色:
一般长用颜色 Common colors (red, green, blue, purple, orange, yellow, grey),各有七种变体:
vvlHUE very very light HUE (e.g. vvlred)
 vlHUE      very light
  lHUE           light
   HUE
  dHUE           dark
 vdHUE      very dark
vvdHUE very very dark
3.2 CYTOGENETIC BAND COLORS
gposNNN # NNN = 25, 33, 50, 66, 75, 100 gpos gvar gneg acen stalk
3.3人染色体颜色:
详细的定义方式click here 配色参考表color conf 科学作图配色方案Brewer pallete
3.4透明度设置:
颜色的透明度可以通过后缀_aN来设置,透明程度为N。
green    fully opaque
green_a1 16% transparent
green_a2 33% transparent
green_a3 50% transparent
green_a4 66% transparent
green_a5 83% transparent
conf文件解读
show_heatmaps = yes
<plots>
<plot>
show = conf(show_heatmaps)
# 表示这是一个heatmap类型的plot
type = heatmap
file = data/heatmap1.txt
# 蓝色基调的9色面板
color = blues-9-seq
# Circos需要将数据文件中的数值进行映射进min和max区间,从而赋予不同颜色,这就需要考虑下面两个因素
# 一是不同颜色区间的分配,由参数color_mapping设置
# 二是线性/非线性映射,由参数scale_log_base设置,默认为线性映射,不需设置该值
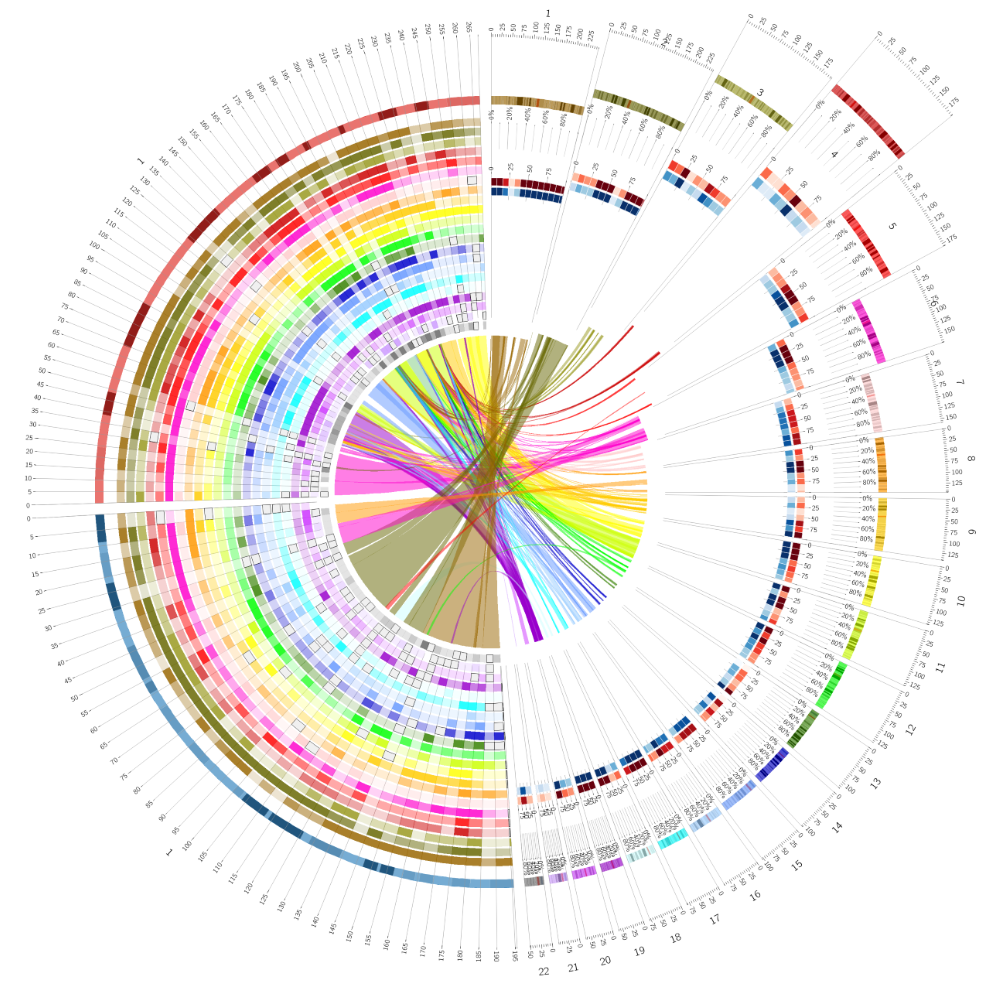
# 这些不同可参见下图
min = 0
max = .20e6
# r0和r1为热图的显示半径
r0 = 0.765r
r1 = 0.785r
# 每个色块边缘颜色及宽度
stroke_color = white
stroke_thickness = 1p
</plot>
<plot>
show = conf(show_heatmaps)
type = heatmap
file = data/heatmap2.txt
color = reds-9-seq
min = 0
max = .20e6
r0 = 0.79r
r1 = 0.81r
stroke_color = white
stroke_thickness = 1p
</plot>
<plot>
show = conf(show_heatmaps)
type = heatmap
file = data/heatmap3.txt
color = blues-9-seq
min = 0
max = .10e6
r0 = 0.895r
r1 = 0.915r
stroke_color = white
stroke_thickness = 1p
</plot>
<plot>
show = conf(show_heatmaps)
type = heatmap
file = data/heatmap4.txt
color = reds-9-seq
min = 0
max = .10e6
r0 = 0.92r
r1 = 0.94r
stroke_color = white
stroke_thickness = 1p
</plot>
</plots>
细心的你也许发现,上面四个plot模块中变化的有:
- 文件名从heatmap1.txt变到了heatmap4.txt
- 颜色面板
- 半径 不变的有:
- min
- max
- 线条颜色
- 线条粗细 这不难让我们去寻求更简单的方式。 Circos为我们提供了一个自动计数的功能counter举个栗子:
heatmap.chain.conf:
<plot>
# 设置变量chain,默认从0开始计数,这里的“:1”即累加1
pre_increment_counter    = chain:1
# 用counter调用当前数值,输入不同数据文件
file            = data/heatmap.counter(chain).txt
show            = conf(show_heatmaps)
type            = heatmap
min            = 6000
max            = 50000
# 同样利用counter设置颜色、位置半径等
color        = eval(join(",",map { sprintf("chr%d_a%d",counter(chain),$_) } (5,4,3,2,1) ))
r0        = eval(sprintf("%fr",0.99-counter(chain)*.025-.02))
r1        = eval(sprintf("%fr",0.99-counter(chain)*.025))
stroke_thickness    = 0

<rules>
<rule>
# 前章提到Circos中是按照从前至后的顺序进行rule判断的,而importance可用来改变该判断顺序
# 即importance值越高,顺序越靠前,未设置importance的则放在最后依序判断
importance        = 100
condition        = var(value) < 2000
show            = no
</rule>
<rule>
importance        = 95
condition        = var(value) < 6000
color            = vvlgrey
stroke_color        = black
stroke_thickness    = 1
</rule>
</rules>
</plot>
关于counter的详细信息可查看官网。接下来,我们在主配置文件circos.conf中进行多重include操作即可:
show_heatmaps    = yes
<plots>
# 多重操作,具体看引入的数据情况,需要多少就用多少个
<<include heatmap.chain.conf>>
<<include heatmap.chain.conf>>
<<include heatmap.chain.conf>>
...

</plots>
这样清晰明了,便于管理。
*部分内容引用自wenlong Shen's blog